forum
library
tutorial
contact

Analysis Questions Economics of Barging
by Eric BarkerLewiston Tribune, January 21, 2013
|
the film forum library tutorial contact |

|
Analysis Questions Economics of Bargingby Eric BarkerLewiston Tribune, January 21, 2013 |
Kooskia-area man known for his opposition to megaloads says grain shipments costly to taxpayers
 A critic of the Port of Lewiston says U.S. taxpayers are shelling out $13,000 to $18,000 for every barge that leaves the port and collectively subsidizing farmers who use the river transportation system about $2 million per year.
Linwood Laughy, a Kooskia-area resident who was one of the leading opponents of megaload traffic on U.S. Highway 12, said the cost of keeping the river's shipping channel clear of sand and other sediment is huge compared to the amount of goods transported to downriver destinations like the Port of Portland.
Admittedly a layman when it comes to economic analysis, Laughy nonetheless said his numbers are both solid and shocking.
"I have to admit I was shocked when I first ran the data," he said. "I thought, 'Nah, there is a decimal point off.' But I kept coming up with the same answer and I thought, 'Oh my God, this is pretty damn spendy.' "
Without accepting or rejecting his analysis, which neither has seen, Port of Lewiston manager David Doeringsfeld and U.S. Army Corps of Engineers spokesman Bruce Henrickson defended the river transportation system.
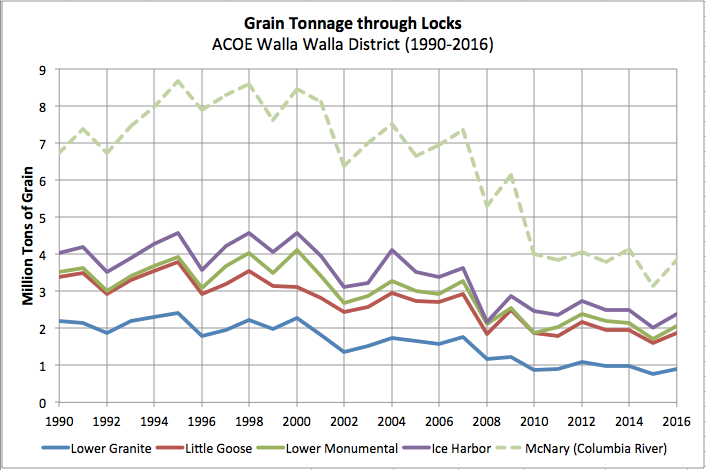
About 220 barges each loaded with 100,000 bushels of wheat or barley leave the Lewis Clark Terminal at the Port of Lewiston each year, Doeringsfeld said. Based on the current price of wheat that equates to just shy of $1 million per barge, he said.
"You have $220 million just in agriculture exports leaving the Port of Lewiston. The cost of barging over rail is maybe one-third of the cost of rail so that is a significant saving to the area ag community provided by the Columbia-Snake system and that is just simple math."
Henrickson said one barge is equal to about 35 railroad cars and 134 tractor-trailers, saving both wear and tear on the road and reducing the number of fossil fuels burned and the amount of pollution released into the atmosphere.
"We are here to serve the public and help goods move up and down the river, and the river transportation system does have its efficiencies," Henrickson said.
Laughy began his analysis by looking at the recent release of the corps' draft Programmatic Sediment Management Plan, a 20-year outline for dealing with sediment accumulation in lower Snake River reservoirs. The plan calls for long-term actions and for short-term measures such as dredging more than 400,000 cubic yards of sediment from the channel as soon as next winter.
He focused his analysis on the confluence of the Snake and Clearwater rivers where most navigation dredging has occurred. When it comes to goods shipped on the river he excluded the Port of Clarkston, which has not operated its crane in several years. Nor did he look at the Port of Wilma, which sits downstream of where most navigation dredging has occurred.
He calculated that the corps has removed about 3.7 million cubic yards of sediment from the shipping channel in the past 21 years for an average of about 177,950 cubic yards per year. The last time the corps dredged the shipping channel, in 2005, it removed about 400,000 cubic yards at a cost of $5.1 million, or $12.75 a yard. So he figures it will cost about $2.3 million a year to remove 177,950 yards of sediment.
But Laughy said that is just the cost to do the dredging. Add in the cost to perform pre-dredging environmental analysis and the price, by his figuring, climbs to about $3.2 million a year. He used the corps' expenditure of $16 million to write a draft sediment management plan as a basis for his calculation.
In 2011, Laughy said the port shipped about 587,177 tons of grain and other freight downriver. Divide that by $3.2 million and he gets $5.40 a ton. A fully loaded barge weighs about 3,500 tons, so by his calculations it takes $18,900 of dredging per barge. If the cost of environmental analysis is excluded it comes to $13,510.
"The bottom line is perpetual dredging is going to cost the taxpayers a lot of money," he said.
When he accounts for inflation, Laughy said it will cost about $38 million over the next 10 years to maintain the shipping channel. He welcomes others to look at his numbers and tell him where and why he might be wrong.
His analysis doesn't factor other expenses like the cost to maintain locks on Snake and Columbia river dams. Nor does it consider economic benefits to dredging or the costs and benefits of hydropower production at the dams. That is something salmon advocates who support breaching the four lower Snake River dams to recover threatened and endangered salmon and steelhead would like to see.
"Looking at long-term salmon recovery options, we want to see a regional conversation that has all options on the table," said Sam Mace of the Save Our Wild Salmon Coalition at Spokane. "Part of that is an honest analysis of what the economic costs are for any options we look at, whether it's options that keep the dams in place versus recovery options that involve removing the four lower Snake River dams."
Dustin Aherin, a rafting outfitter and head of the Lewiston-based group Citizens for Progress, said the numbers should lead people to ask if river transportation is the best way to spend our tax dollars.
"Once we do the cost-benefit analysis of keeping the shipping channel on the status quo, we should realize the Port of Lewiston can fairly easily maintain and, from my perspective, grow from switching from water-based transportation to rail-based," he said.

Related Pages:
Electric Power Foregone to Lock Flush by Oregon Natural Resource Council, Restoring the Lower Snake River
Energy Intensities of Freight: Barge, Truck and Railroad US Department of Energy, Transportation Energy Data Book
Shipping Wheat: Truck or Barge? by Ken Casavant, Transportation Report 1995
Snake River Freight by Army Corps of Engineers, Government Report
Snake River Commodity Tonnage by Army Corps of Engineers, Data from 1990-2010
Lewiston Container Shipping by Port of Lewiston, Fact Sheet, 1997
Montana Grain on Lower Snake River by Montana Wheat & Barley, Data from 1985-2001
Snake River Barge Rates by Tidewater Barge Lines, Rate Schedule
learn more on topics covered in the film
see the video
read the script
learn the songs
discussion forum
